Dashboard Overview
The Dashboard is the first thing you see when you log into FirstIn. It gives you a real-time snapshot of how your venue is performing — revenue and performance charts — all in one place.
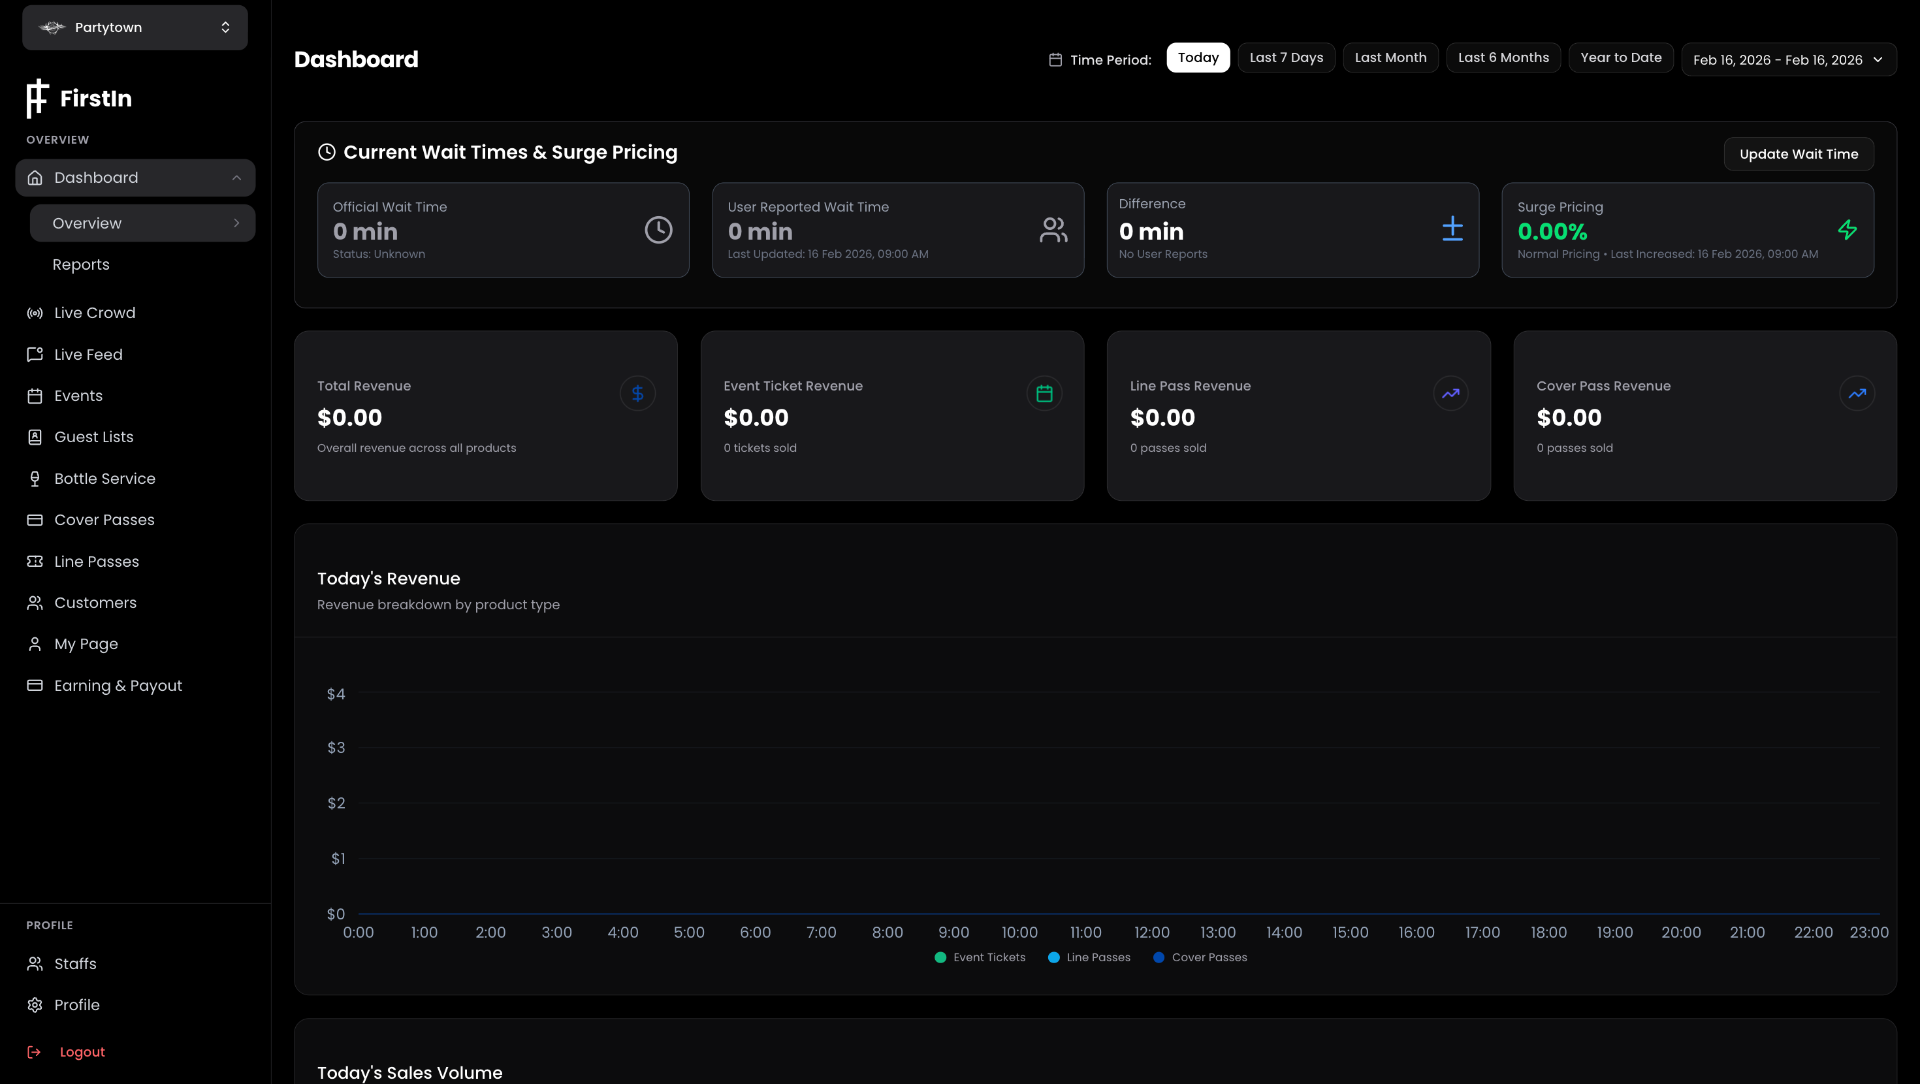
The Top Bar — Time Period Filter
At the top of the Dashboard you'll see a row of time period buttons:
- Today — shows data for the current day only
- Last 7 Days — rolling 7-day view
- Last Month — the previous calendar month
- Last 6 Months — broader trend view
- Year to Date — from January 1st to today
- Custom Date Range — pick any start and end date using the date picker on the right
Switching between these updates every number and chart on the page instantly.

Revenue Cards
At the top of the Dashboard you'll see four revenue summary cards:
| Card | What It Shows |
|---|---|
| Total Revenue | Overall revenue across all products for the selected time period |
| Event Ticket Revenue | Revenue specifically from event ticket sales, with ticket count |
| Line Pass Revenue | Revenue from Line Pass sales, with pass count |
| Cover Pass Revenue | Revenue from Cover Pass sales, with pass count |

Today's Revenue Chart
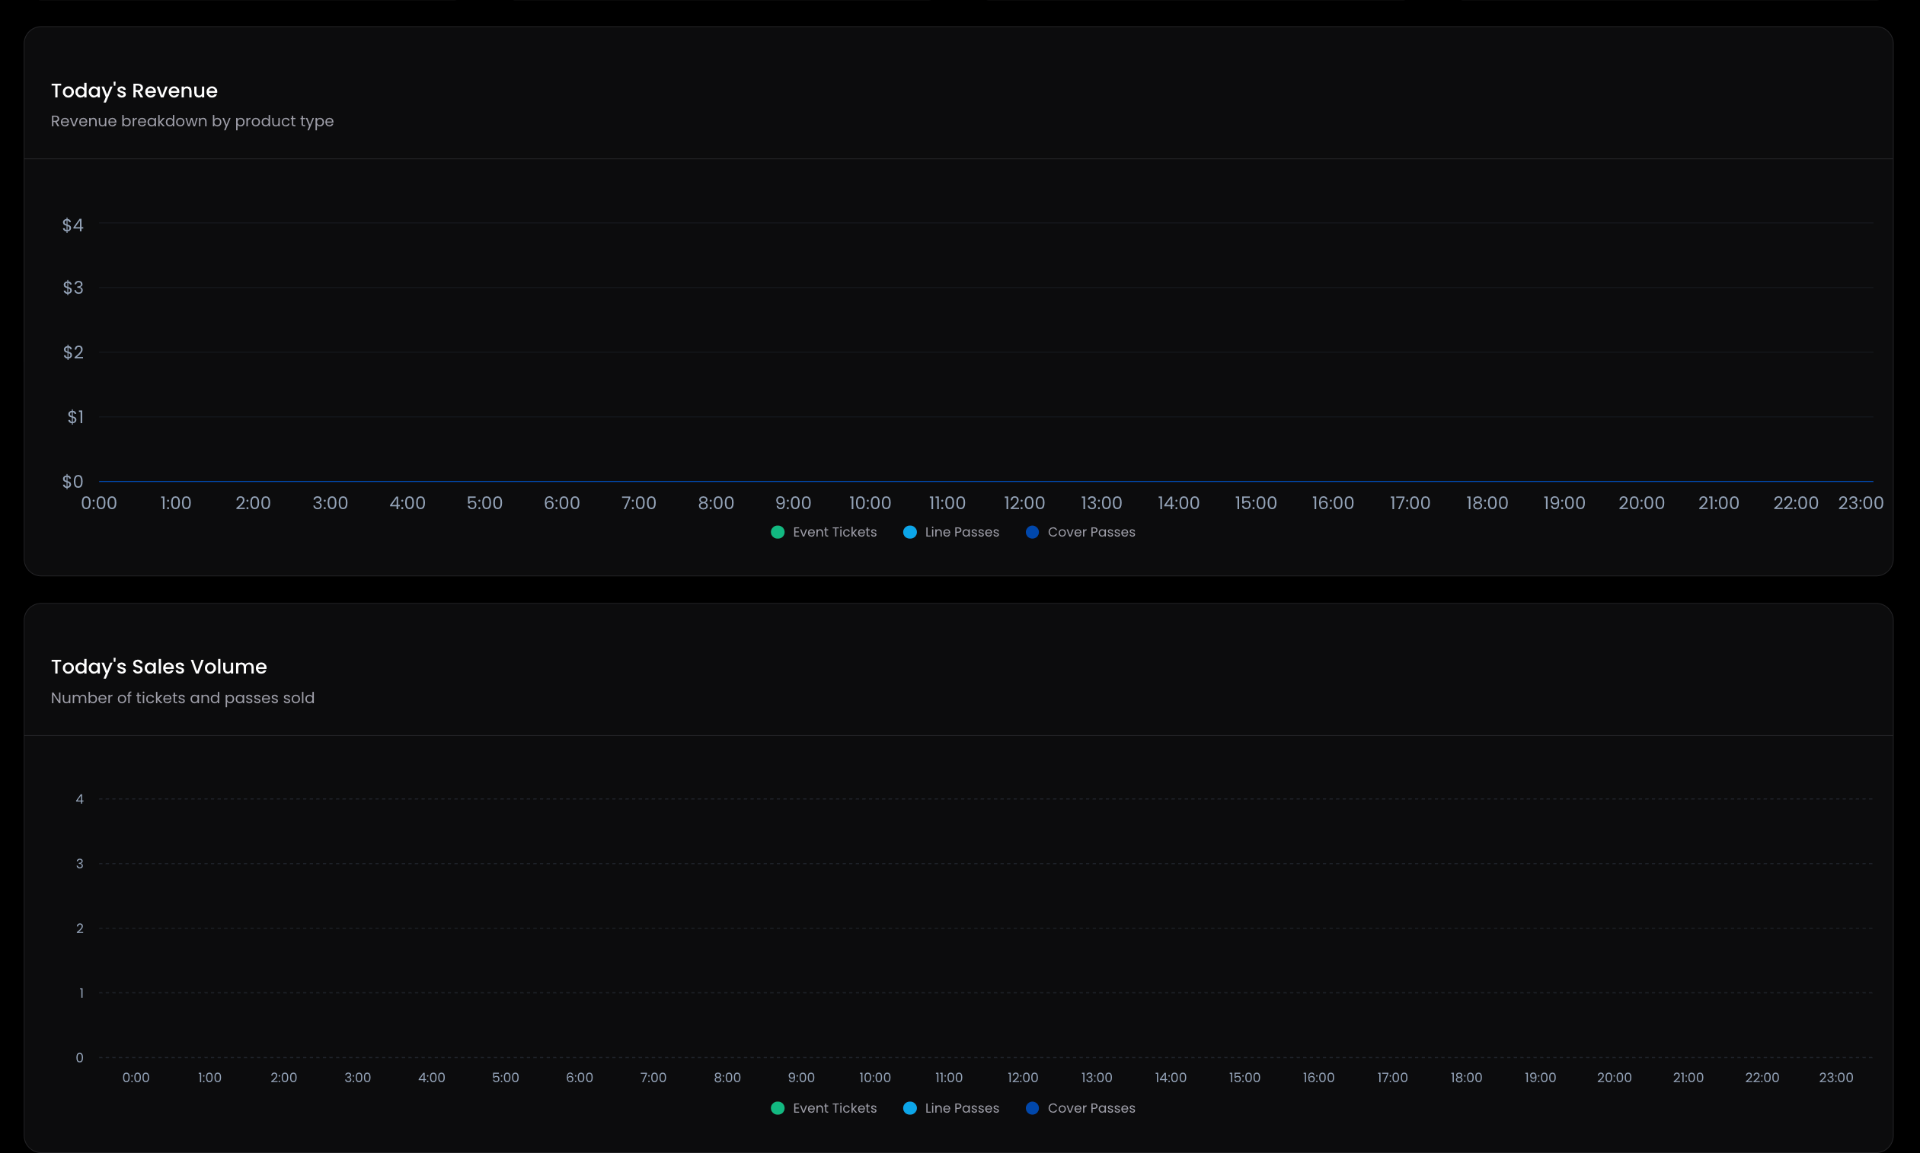
The chart at the bottom of the Dashboard shows your revenue breakdown by product type plotted over time for the selected period. This gives you a visual sense of when revenue is coming in and which products are driving it.
Tips
- Use the time period filter for weekly reviews. Switch to "Last 7 Days" every Monday to see how last week performed at a glance.
- Revenue cards update in real time. During a busy night, refresh the Dashboard to see ticket and pass sales as they come in.